2025-12-11
Visualising Broad Rental Market Areas (BRMAs) in QGIS
I’m trying to start a housing co-op, and doing some financial planning to try and work out how to make that happen. We want to be a Radical Routes housing co-op, and that means that we need to stick to having our rent be equal or lower than local housing allowance (LHA) which is the amount you get for rent if you’re on benefits. This is pretty rad because it means that a) anyone can be involved in a housing co-ops (not just those in high-paying jobs) and b) it means that the project is lower risk than it might be otherwise - if someone loses their job then theoretically they can still pay rent just fine and the project sails on. However, in London, LHA is not really enough to actually pay rent, because of late-stage capitalism, neoliberalism, and years of conservatives governments. Which makes making the numbers add up for a new housing co-op in London quite hard.
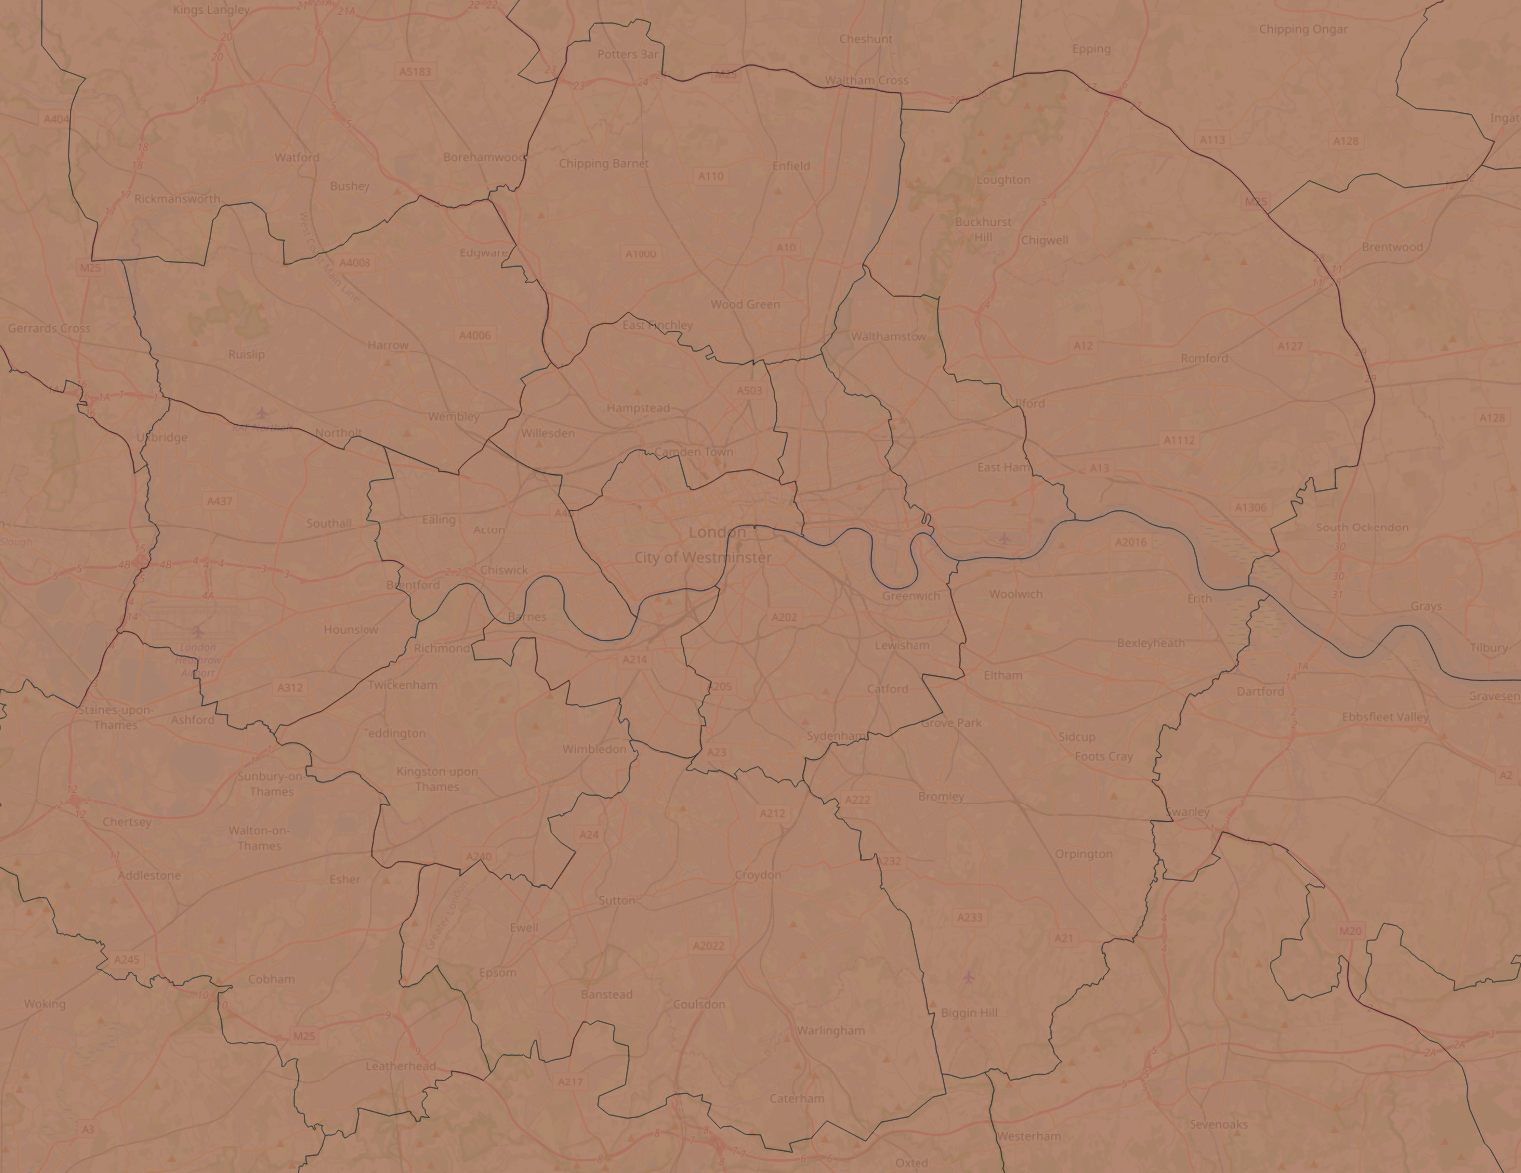
You can plug in a postcode here to find out what the LHA is for any particular location, but I wanted to get a broader idea of where the boundaries are, because being one side of a boundary vs another can have a big difference (e.g. Crouch End: £136.93 per week, Finsbury Park: £163.00 per week). So, I’m learning about Broad Rental Market Areas (BRMAs). These are the geographic blocks that have the same LHA.
I would love to see a nice easy map of them, but the world is not quite so kind, so I had to get nerdy.
Thankfully the data is available: https://www.gov.uk/government/publications/broad-rental-market-area-boundary-layer-for-geographical-information-system-gis-applicable-may-2020.
But visualising it takes a little bit of tinkering. Here’s what I did, in case it’s useful to you (or future me). I’ll go a bit meta on this as well in case it is interesting to see how I solved the problem, I’ll mark the points that you actually need to do in bold if you’re following these as instructions. Fair warning: I’m definitely not an expert, very much a tinkerer, and almost definitely am committing GIS crimes.
- The files are
.gmland.xsd- I have no idea what these are, but I hope they’re something mappy. - I ask Kagi’s quick assistant what these file types are, and how I can open them. I see that QGIS is an option, and I’ve heard of that before and I know it is open-source and I have wanted an excuse to play with it.
- Install QGIS (I’m using version:
QGIS 3.44.5-Solothurn 'Solothurn' (5c593399236)) - Kagi’s quick assistant tells me how to open the files (
Layer > Add Layer > Add Vector Layer, pick the.gmlfile). - Nice - I see the boundaries, but they’re unlabelled shapes, and I would like to be able to reference them to “oh that’s where I live!” level.
- I install the QuickMapServices Plugin
- For reasons unknown to me (something with co-ordinate systems…?) I work out that this actually only works if I load “OSM standard” before loading my BRMA data.
-
Then, it kind of works. Sort of.
- I try very hard to just pick up and drag the maps on top of eachother, but the GIS forums tell me this is a sin and I should be punished for even considering it.
- It looks like I’m using the wrong co-ordinate system.
- After lots of poking it turns out I’m using no co-ordinate system (right click on BRMA layer, layer CRS, “No CRS” 💩), which doesn’t sound ideal.
- And I have no idea what co-ordinate system it should be using.
- I try lots of things to work out what it should be using.
- I poke around in the
.xsdfile, which I assume is some sort of metadata file. - I copypaste the header from that file into Kagi’s quick assistant and ask what CRS it should be using. It tells me that the file doesn’t say, but that given the context I probably want “British National Grid (BNG), which corresponds to EPSG:27700”.
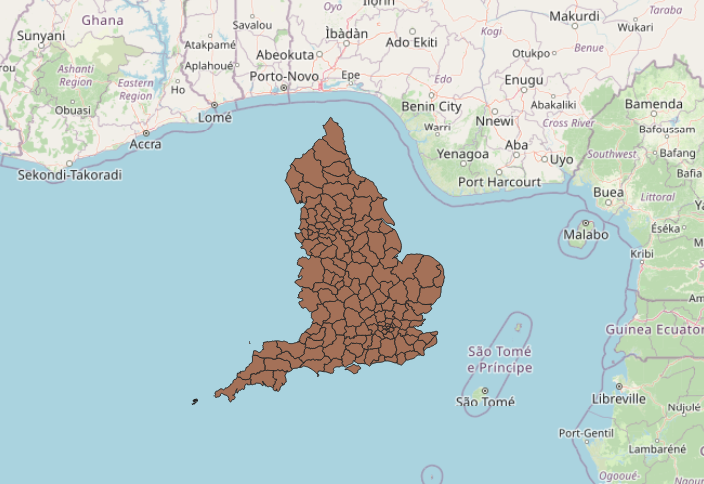
- right click on BRMA layer, layer CRS, Set Layer CRS, search EPSG:27700, OK, (then there’s a few options but the default worked for me) and it works!
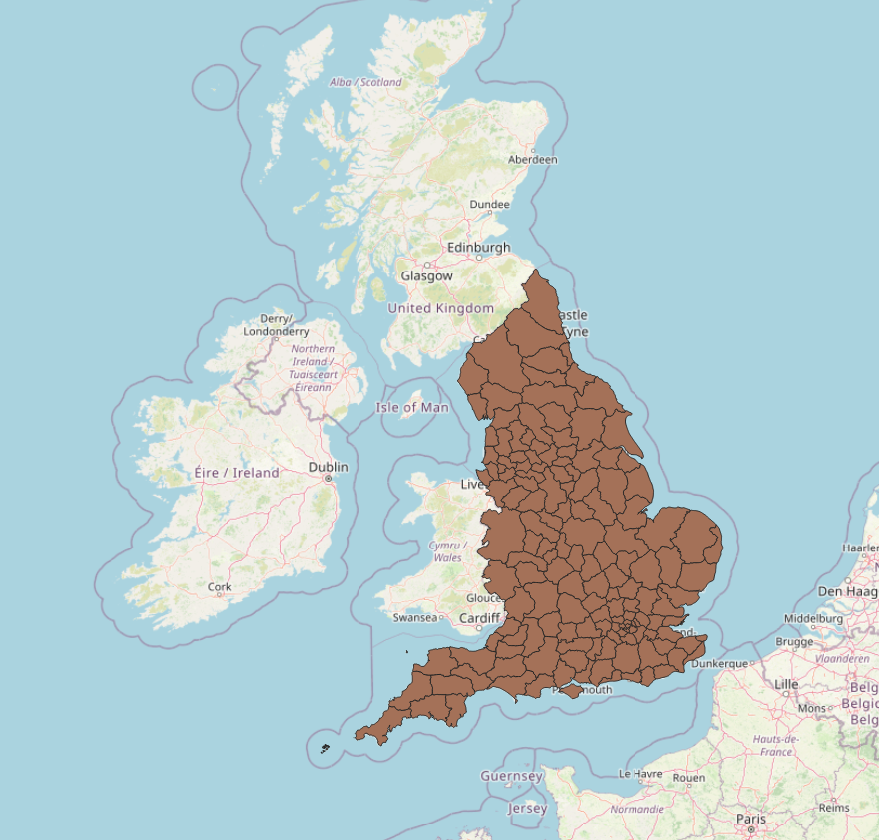
Finally I mess around with the transparency (right click BRMA layer, properties, legend, enable opacity slider), and hey presto! 🎉
Happy mapping ya cuties 🗺️
This post is published under a CC BY 4.0 licence.